V · Commercial processes · Chapter 20
Finance I — Performance: measures, KPIs and financial statements
A single definition for every figure; the scorecard, financial statements and KPIs read from the same source.
Accounting answers the question "what happened?". The Finance application answers "what should have happened, what will happen, what should we do?". The previous chapter described the record itself; this chapter describes how those records turn into management.
Finance spreads over three chapters: this one covers performance (measure, indicator, financial statement), chapter 21 the budget (plan, control, drivers, cash), chapter 22 objectives (OKR). Chapter 23 is a budget management lesson independent of the product — at a level someone who does not use PORTWARE can read too.
The carrying idea: one definition for every figure
The whole Finance application is built on a single idea, and without understanding it the rest is just a pile of screens.
A measure is a named figure: Net Sales, Cash and Cash Equivalents, Tangible Fixed Assets. Which accounts it is computed from is defined once, centrally. 65 measures come ready, based on Turkey's uniform chart of accounts.
Then this happens: the indicator on the scorecard, the line in the income statement, the line in the budget and the opening balance of the cash projection — all of them read the same measures.
                    ┌─ Scorecard (KPI)
                    │
   Measure     ─────┼─ Financial statement line
   registry         │
   (65 measures)    ├─ Budget line
                    │
                    └─ Cash projection opening balance
Why like this: when every report carries its own list of accounts, the "Sales" figure comes out differently in the marketing presentation, the accounting report and the budget table; when one is updated the others silently go stale. With the definition kept centrally, when the chart of accounts changes one measure is corrected, not forty reports — and the meeting moves from arguing "what is the figure?" to "what should we do?".
Menu map
Finance
├── Scorecard                   finance reader
├── Financial Statements        finance reader
├── KPI                         finance reader
│   ├── Definitions
│   ├── Targets
│   └── History
├── Budgets … Cash Panel        (chapter 21)
├── OKR                         EVERY EMPLOYEE (chapter 22)
├── Configuration               finance manager
│   ├── Measures
│   ├── Glossary
│   └── Definitions
└── Readiness finance reader| Role | What it does |
|---|---|
| Finance › Reader | Sees the scorecard, statements, budget and cash screens |
| Finance › Manager | Defines measures/KPIs, approves budgets, publishes targets, changes the control policy |
| OKR Manager | Opens, activates, closes and scores cycles |
| Every employee | Writes their own objectives and key results, reports status |
Readiness — "can I start?"
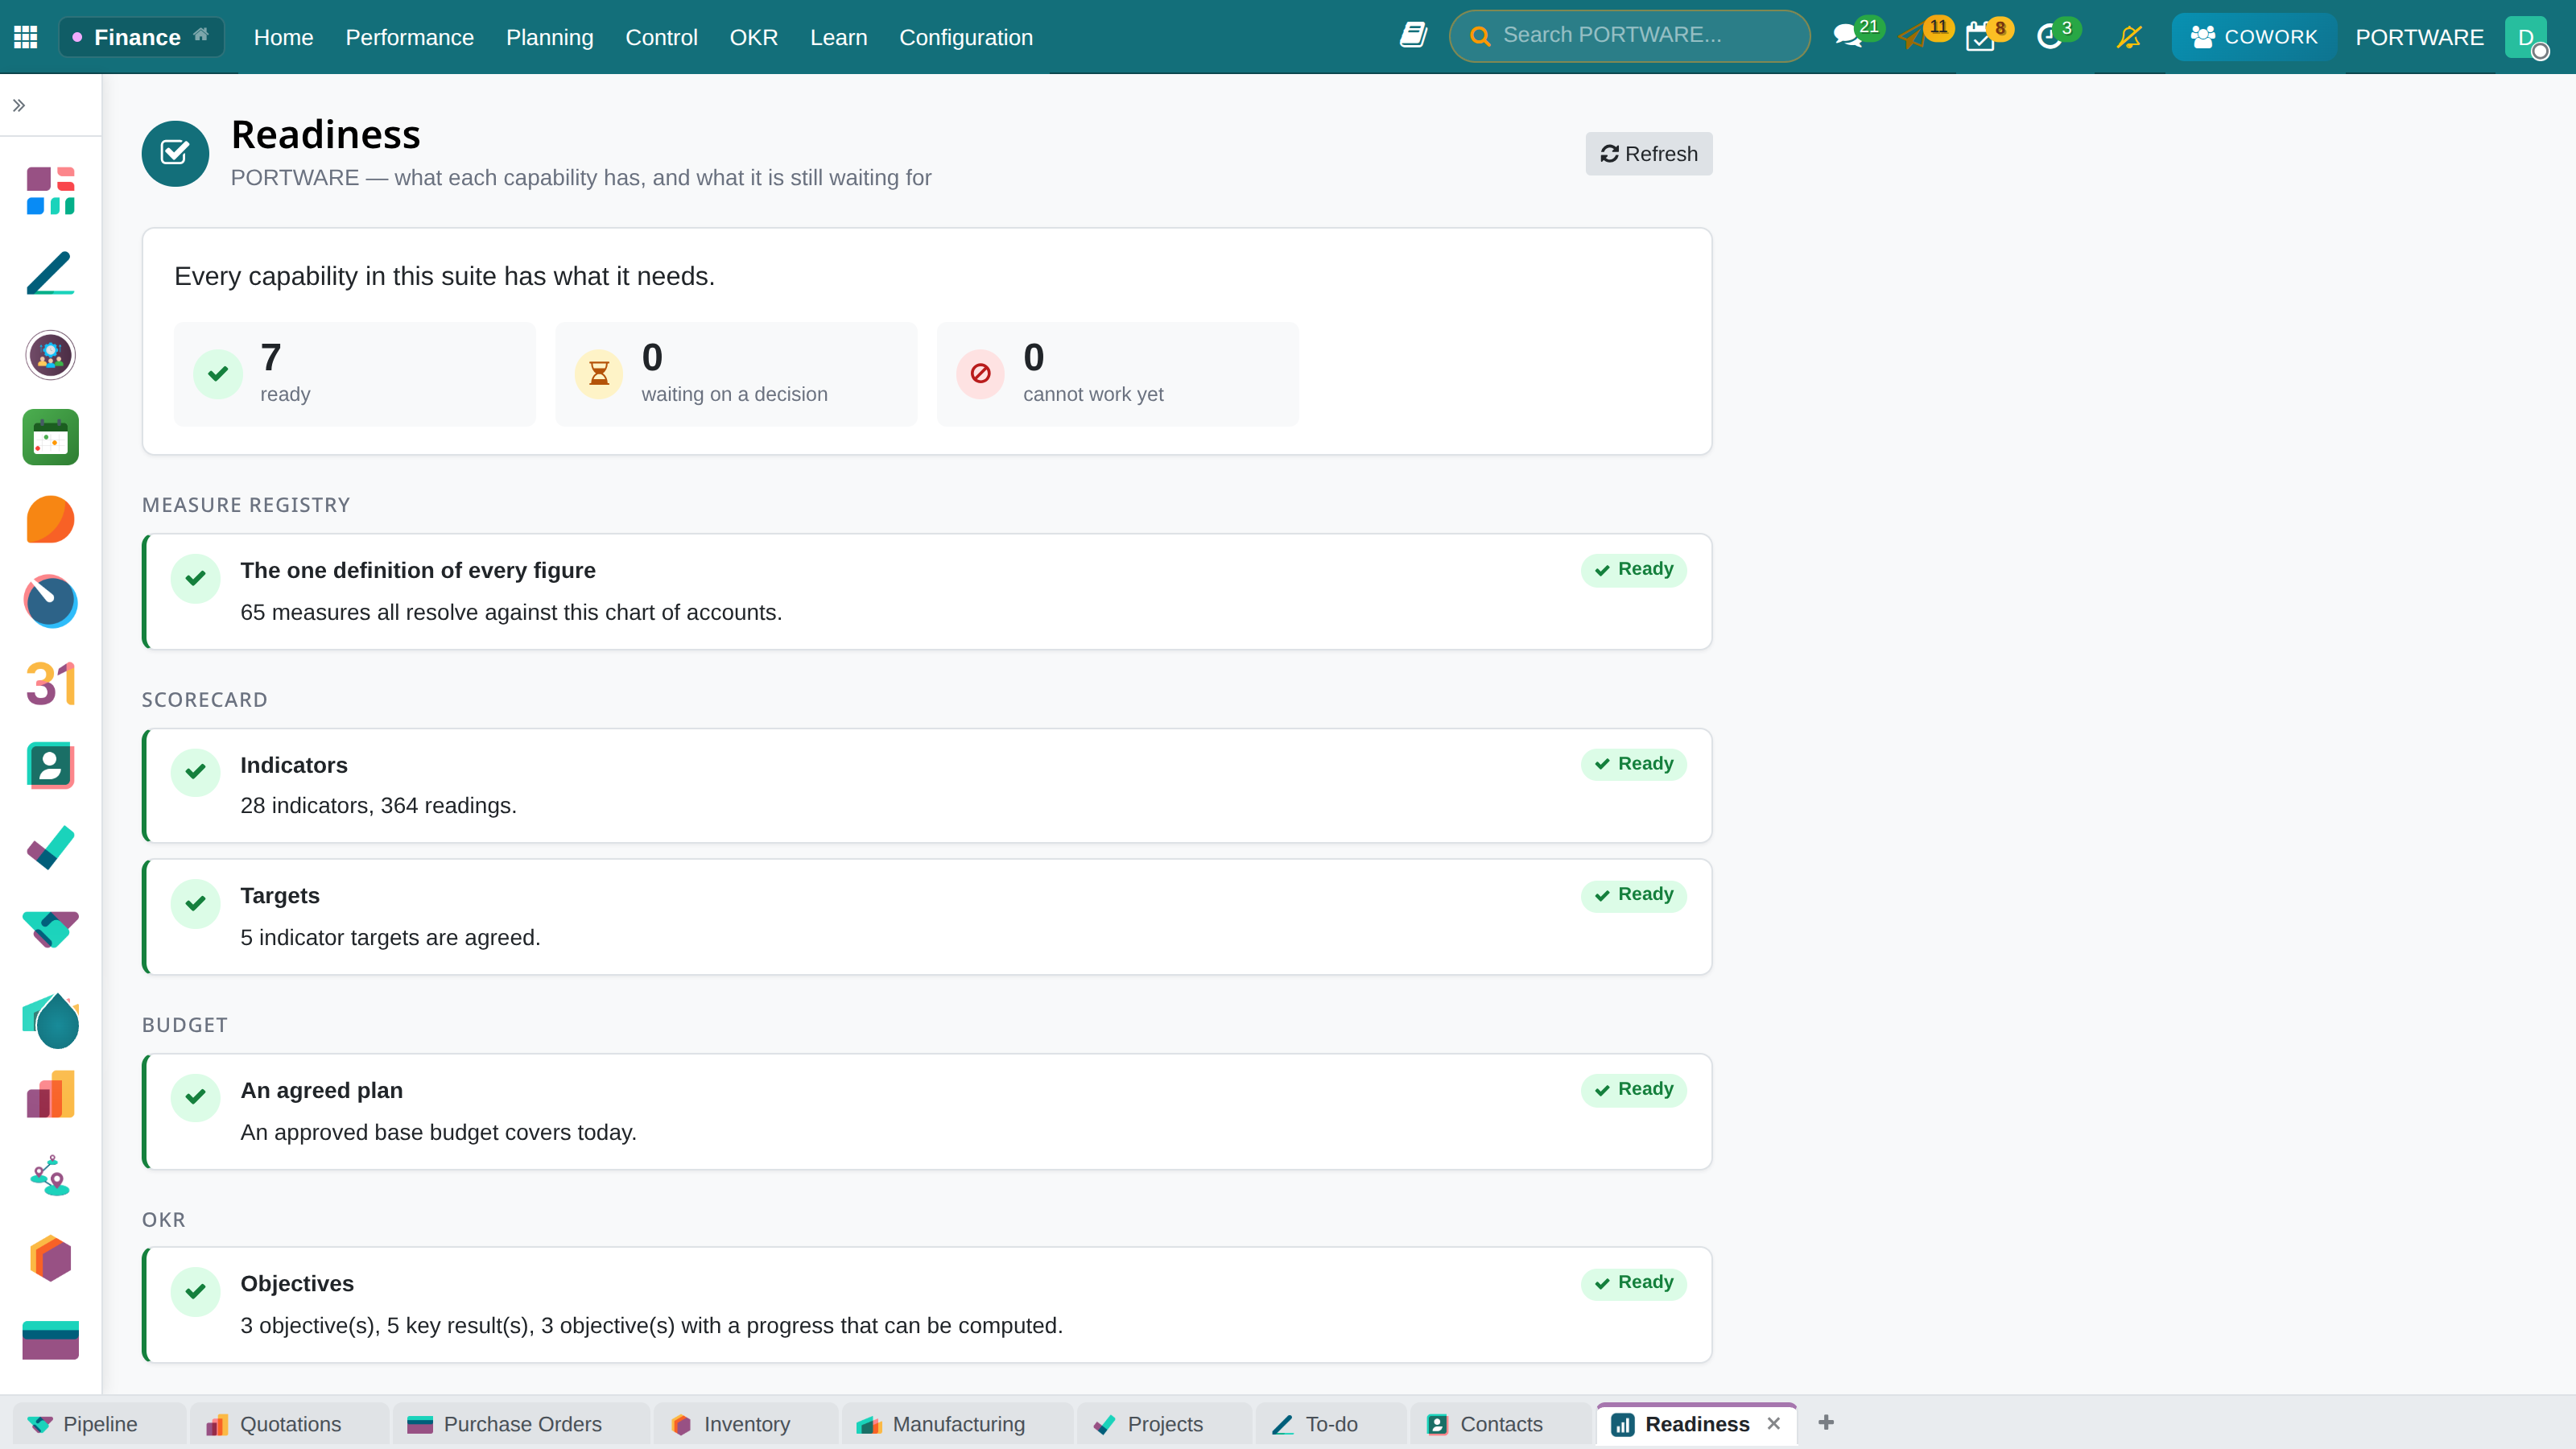
Finance › Readiness. This is the first step of training and setup. It shows each capability in one of three states:
- Ready — it does its job today.
- Awaiting a decision — it works but a human decision has not been made. Until then it reads empty, not wrong.
- Cannot work yet — it does not work until something is fixed.
Each row states a fact and a next step. This screen is the place to open when looking for the answer to "why is this report empty?".
Scorecard
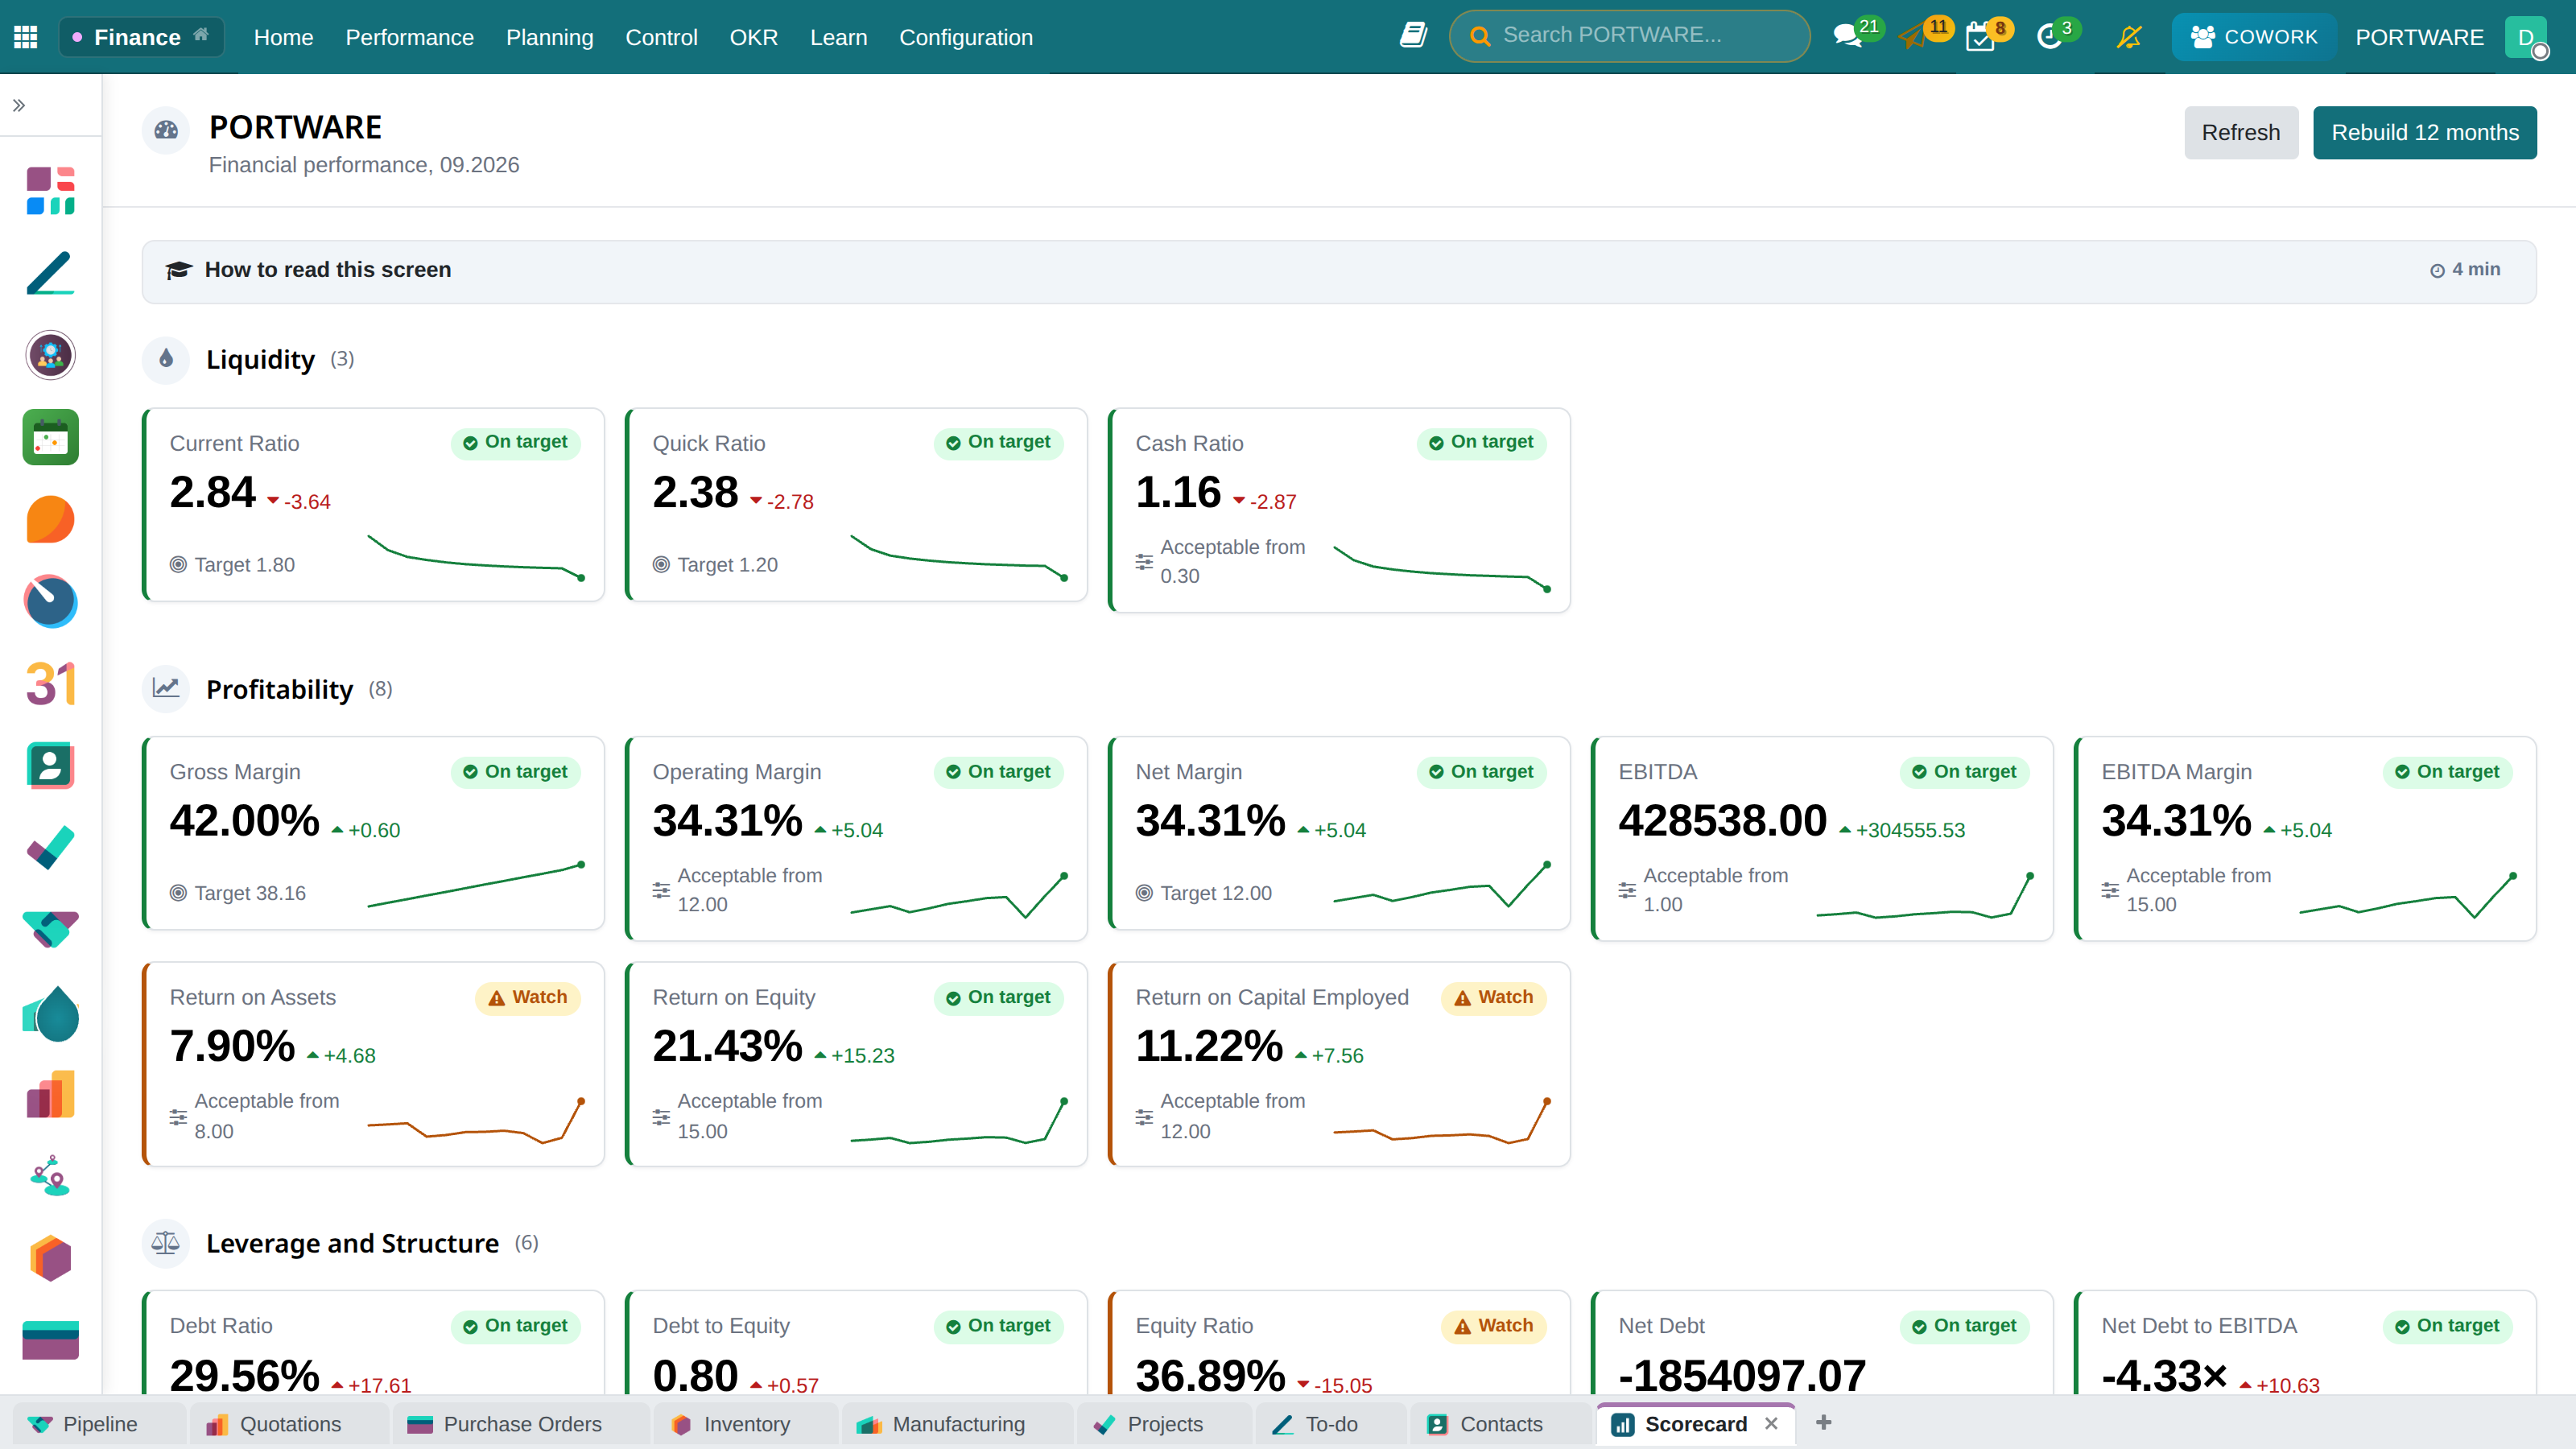
Finance › Scorecard. 28 indicators per company, in six categories:
| Category | Example indicators |
|---|---|
| Liquidity | Current Ratio, Acid-Test Ratio, Cash Ratio |
| Profitability | Gross Profit Margin, Operating Profit Margin, Net Profit Margin |
| Leverage and Structure | Debt Ratio, Debt / Equity, Equity Ratio |
| Cash and Working Capital | Net Working Capital, Days Sales Outstanding, Days Payable Outstanding |
| Operating Efficiency | Receivables Turnover, Inventory Turnover, Payables Turnover |
| Growth | Export Share |
Each card has the value, a 12-month trend line, the target and the status. The status is shown both with a coloured edge and with a mark shape — so that a colour-blind reader and a black-and-white print see the same thing.
When a card is opened it says which measures the indicator is computed from. The only way to trust a figure is to be able to see where it comes from.
For managers, the "Rebuild 12 months" button computes the history; in a newly set up system this is the way to fill the trend lines.
Financial Statements
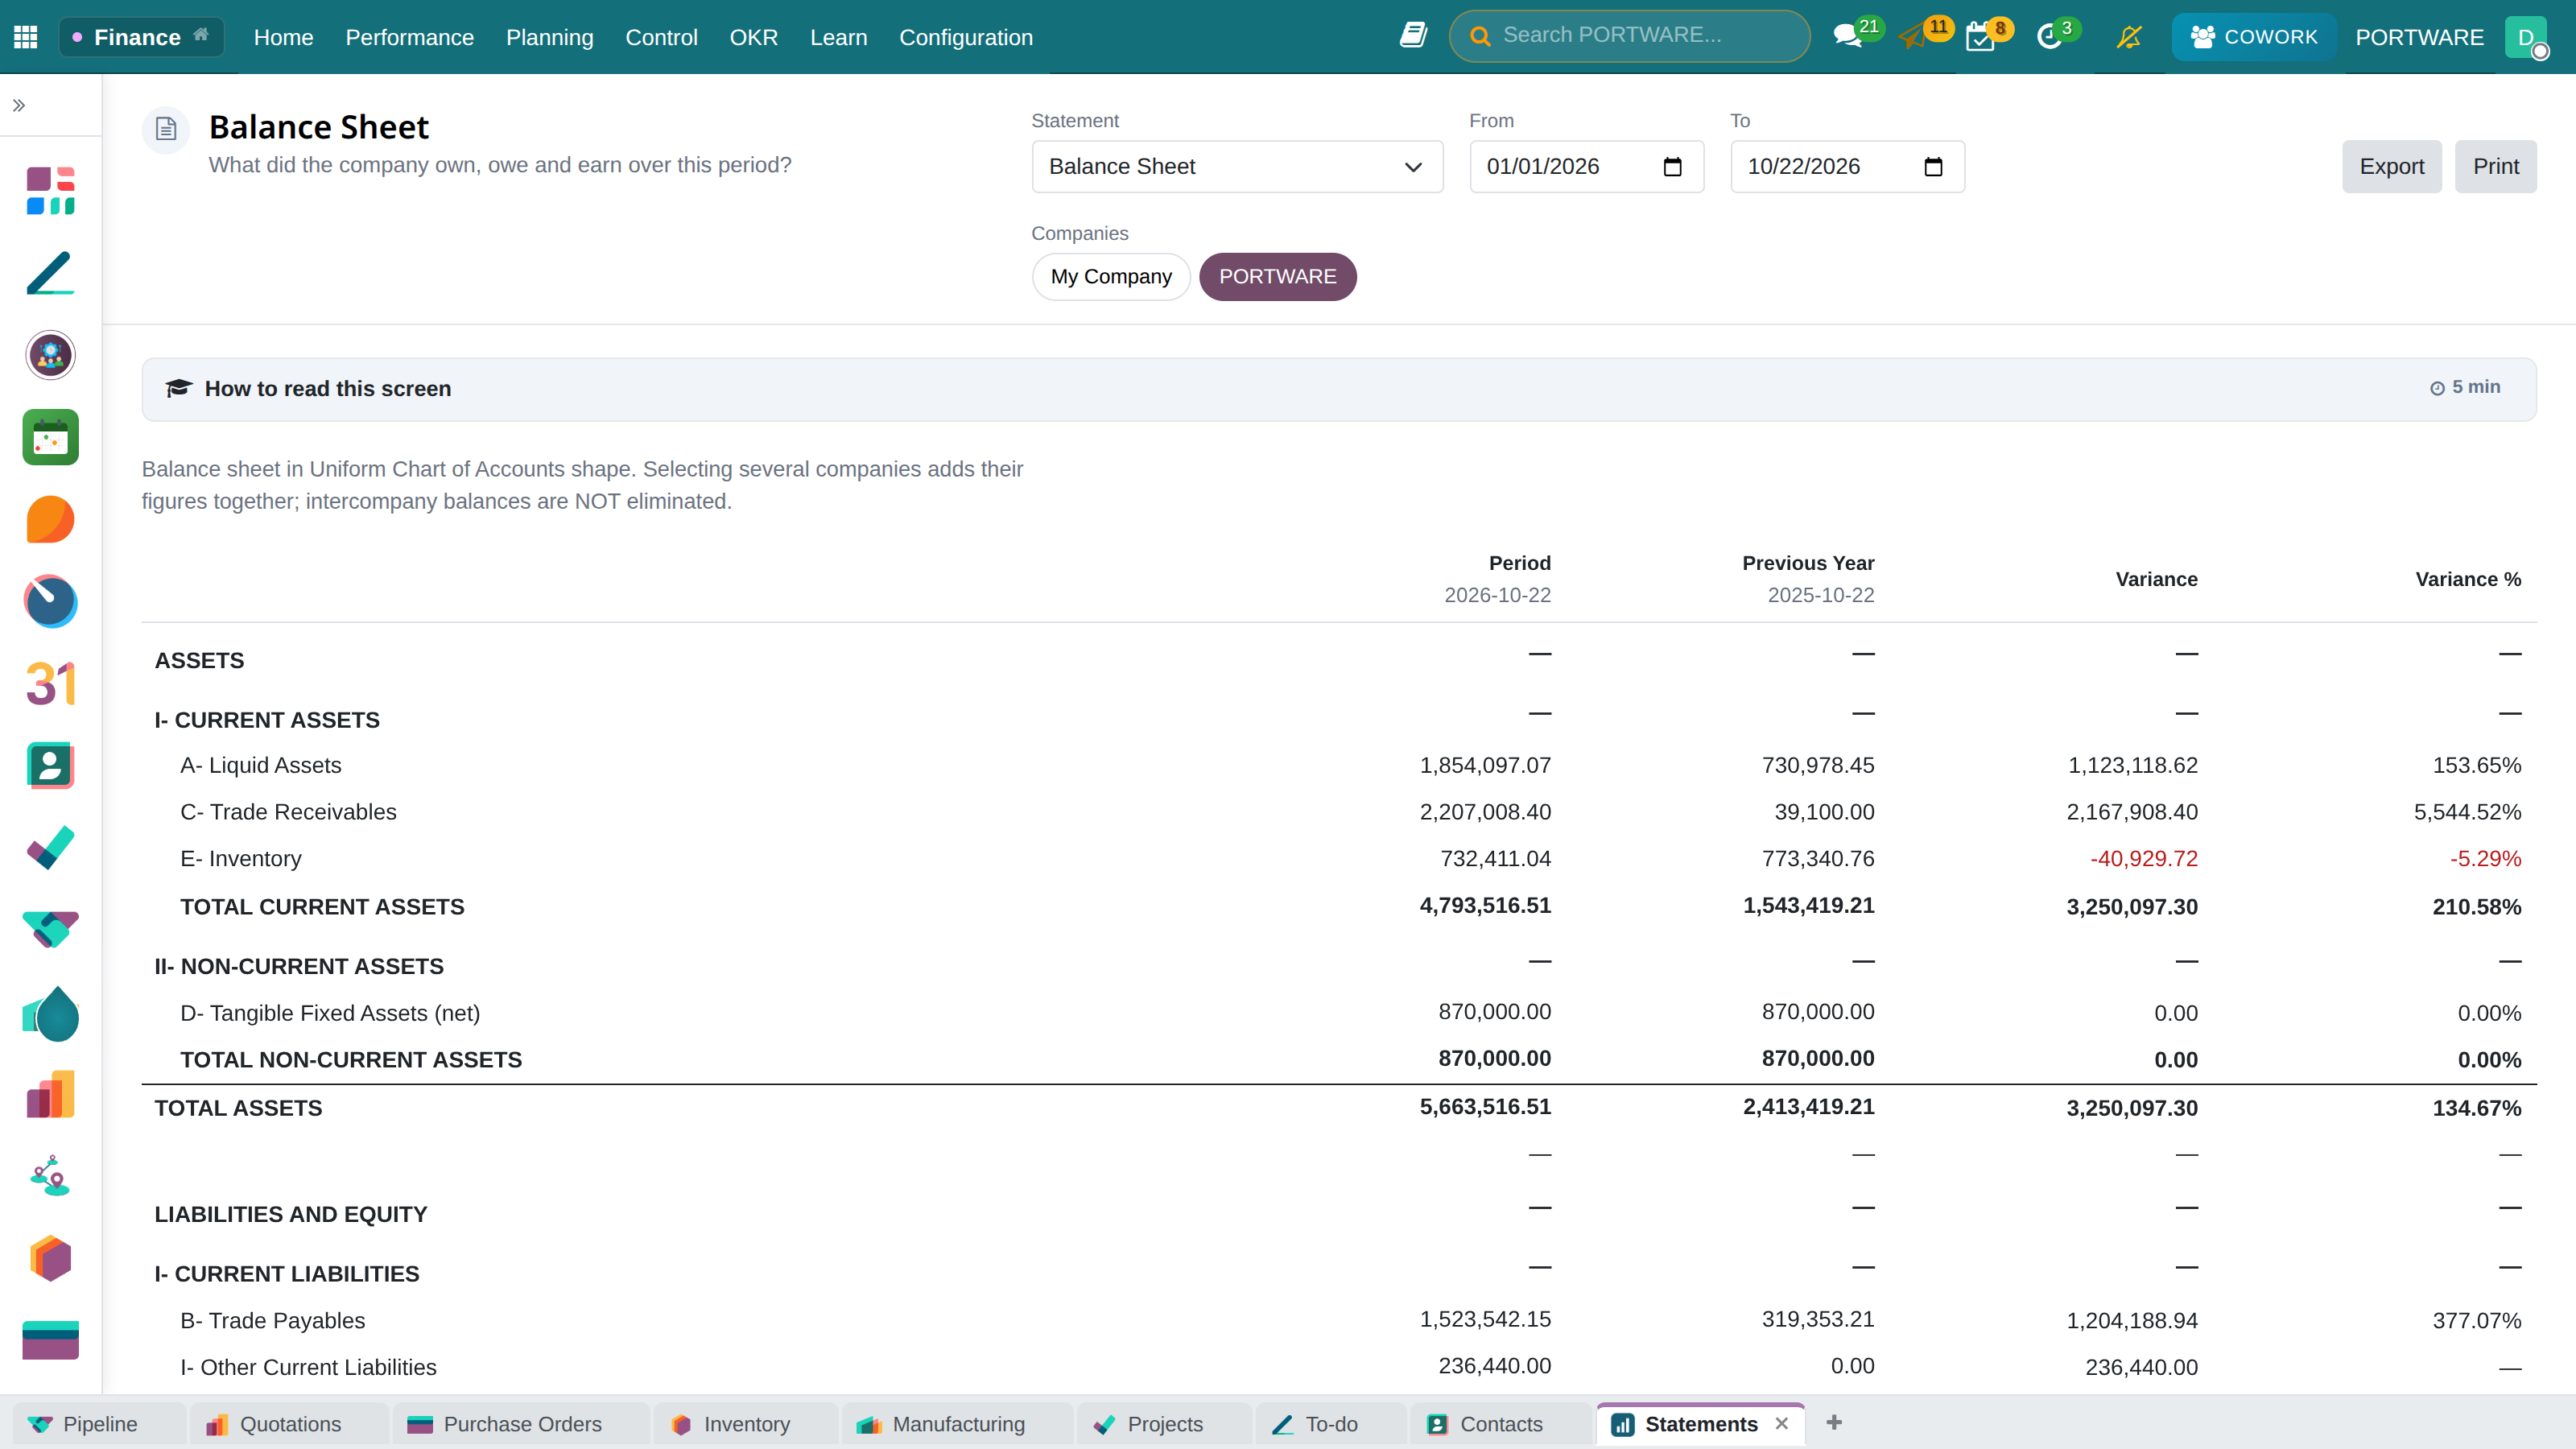
Finance › Financial Statements. Four reports based on the uniform chart of accounts:
| Report | Lines |
|---|---|
| Balance Sheet | 51 |
| Income Statement | 20 |
| Cash Flow Statement (indirect) | 16 |
| Financial Ratios | 21 |
Columns: period, previous year, difference, difference %, vertical percentage and budget. The budget column brings the budget of chapter 21 here — plan and actual are read side by side in the same table.
Clicking a cell opens the journal items behind that figure. The report is not a summary but a door. XLSX and PDF outputs are produced from the same calculation path; the exported figure is the figure on screen.
KPI — definition, target, history
Definitions
A KPI's formula is arithmetic on measure codes only:
CURRENT_ASSETS / CURRENT_LIABILITIESAccount codes cannot be written into the formula. A formula that cannot be computed cannot be saved — a broken indicator is never born. This is the single-definition rule enforced: a KPI can speak only of the measures in the registry.
Targets
Targets are per period and normally come not by hand but from OKR (chapter 22). When Publish Target is ticked on a key result, that target becomes the scorecard's target for the period.
History
Every reading and the measure values that produced it are kept. When someone asks "why?" in front of a red indicator, the answer is on the screen: which measure read what that month.
The alert goes to the owner at the moment the indicator turns red — not every month. An alert repeated constantly becomes unreadable; one that comes once and says the state has changed gets read.
Summary of this chapter
- A measure is the single central definition of a figure; every screen reads it.
- The Readiness screen says what works and what is waiting for a human decision.
- The scorecard gives an indicator with its value, trend, target and where it comes from.
- Financial statements drill down from a cell to the journal; the budget column brings the plan alongside.
- An undefined figure is never shown as zero.
The next chapter turns these figures towards the future: budget, control, drivers and cash.